One good thing actually came from the year 2020: Robocalls actually went down overall in the United States (due to the combination of the Pandemic and the TRACED act). It kind of puts everything in a new light, right? Okay, not really, spam calls remain super annoying and we all hate them. But considering the fact we were on a heavy upward trajectory of robocalls from 2018 to 2019, it's nice to see the trend shoot downward over the past year. Here's the number of robocalls that have been placed in the United States over the past three years.
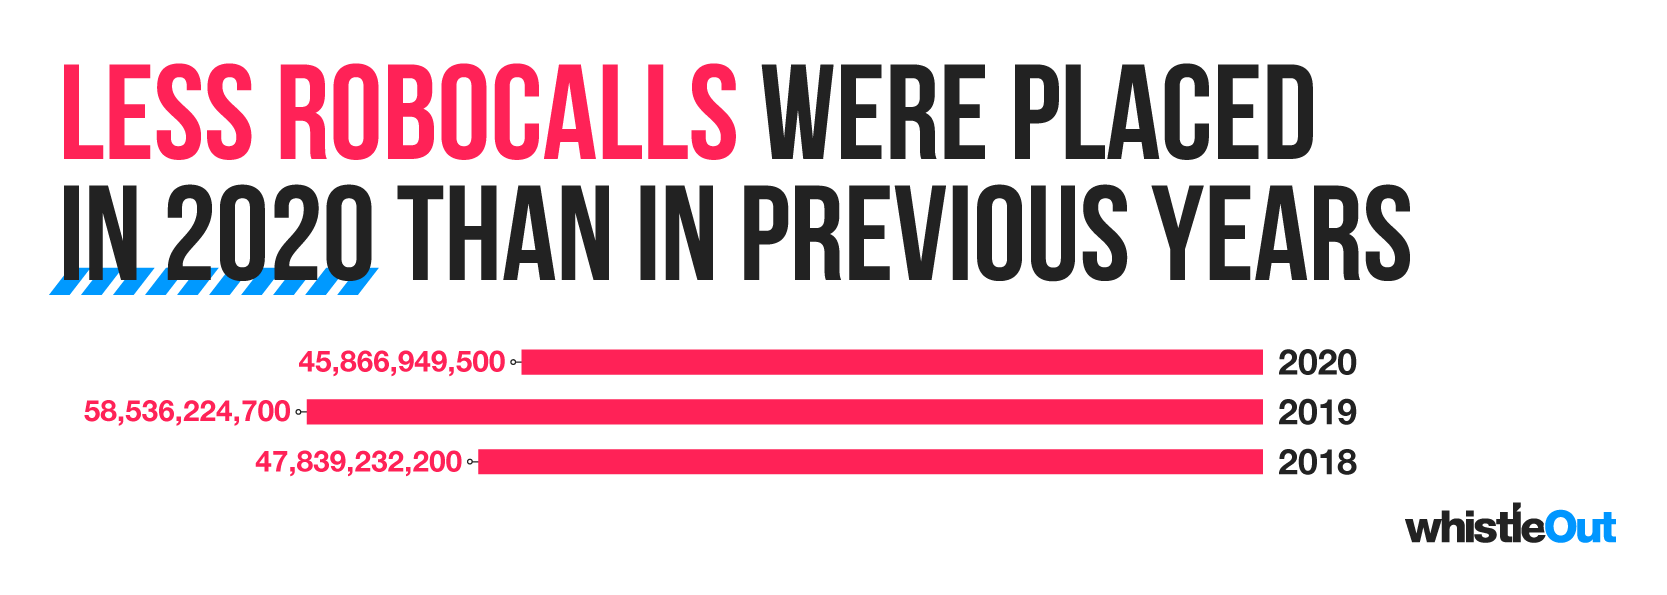
Robocalls by the numbers
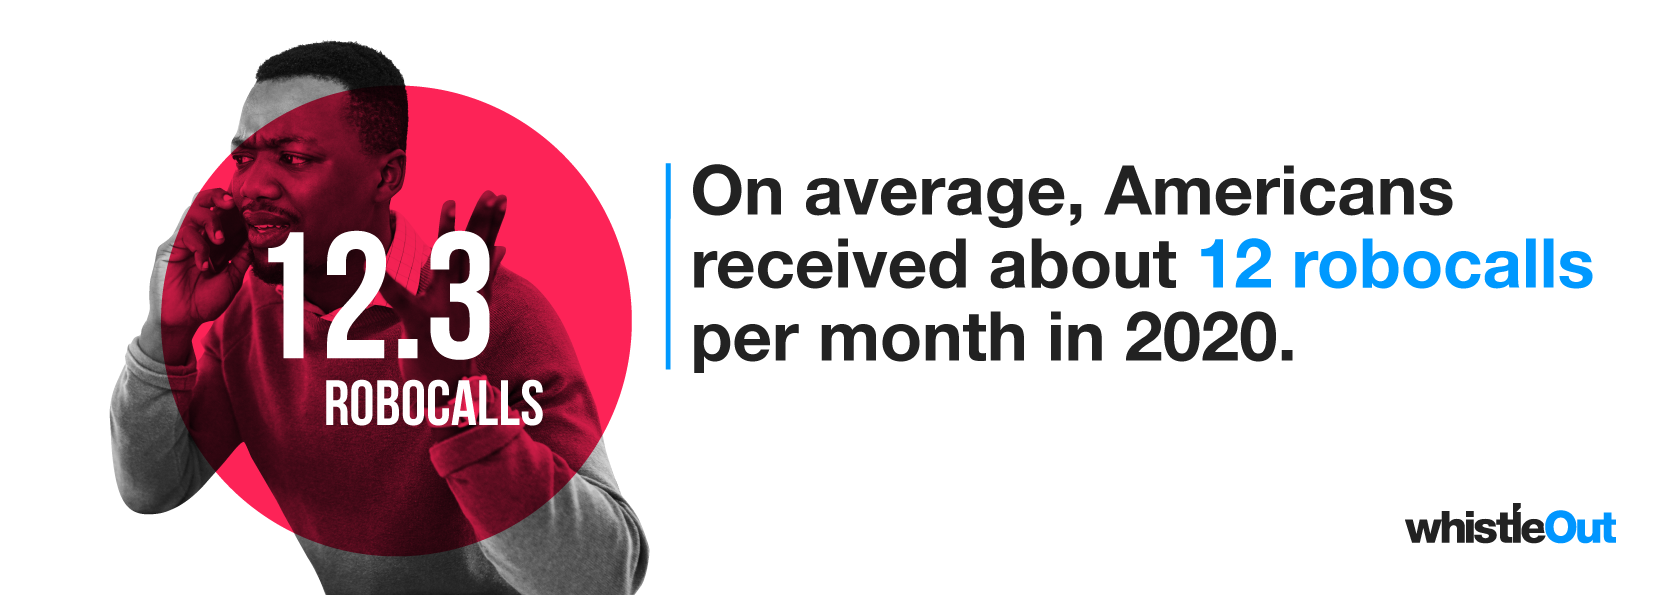
We’ve made some headway in our battle against Robocalls, but we have a long way to go folks. There were about 45 Billion (!) Robocalls placed in the US over the course of the year. Indeed, you probably received around 12 Robocalls every month last year. That’s 12 times a month that you felt the pain of looking down at your ringing phone, hoping to find a loved one on the other end, only to discover a cold, emotionless robot telling you to send money to a Nigerian prince.
States most affected by robocalls
Have you ever wondered if your state is getting hit harder than others when it comes to Robocalls? Way ahead of you. Check out the map below to see what states the Robocallers have in their crosshairs.
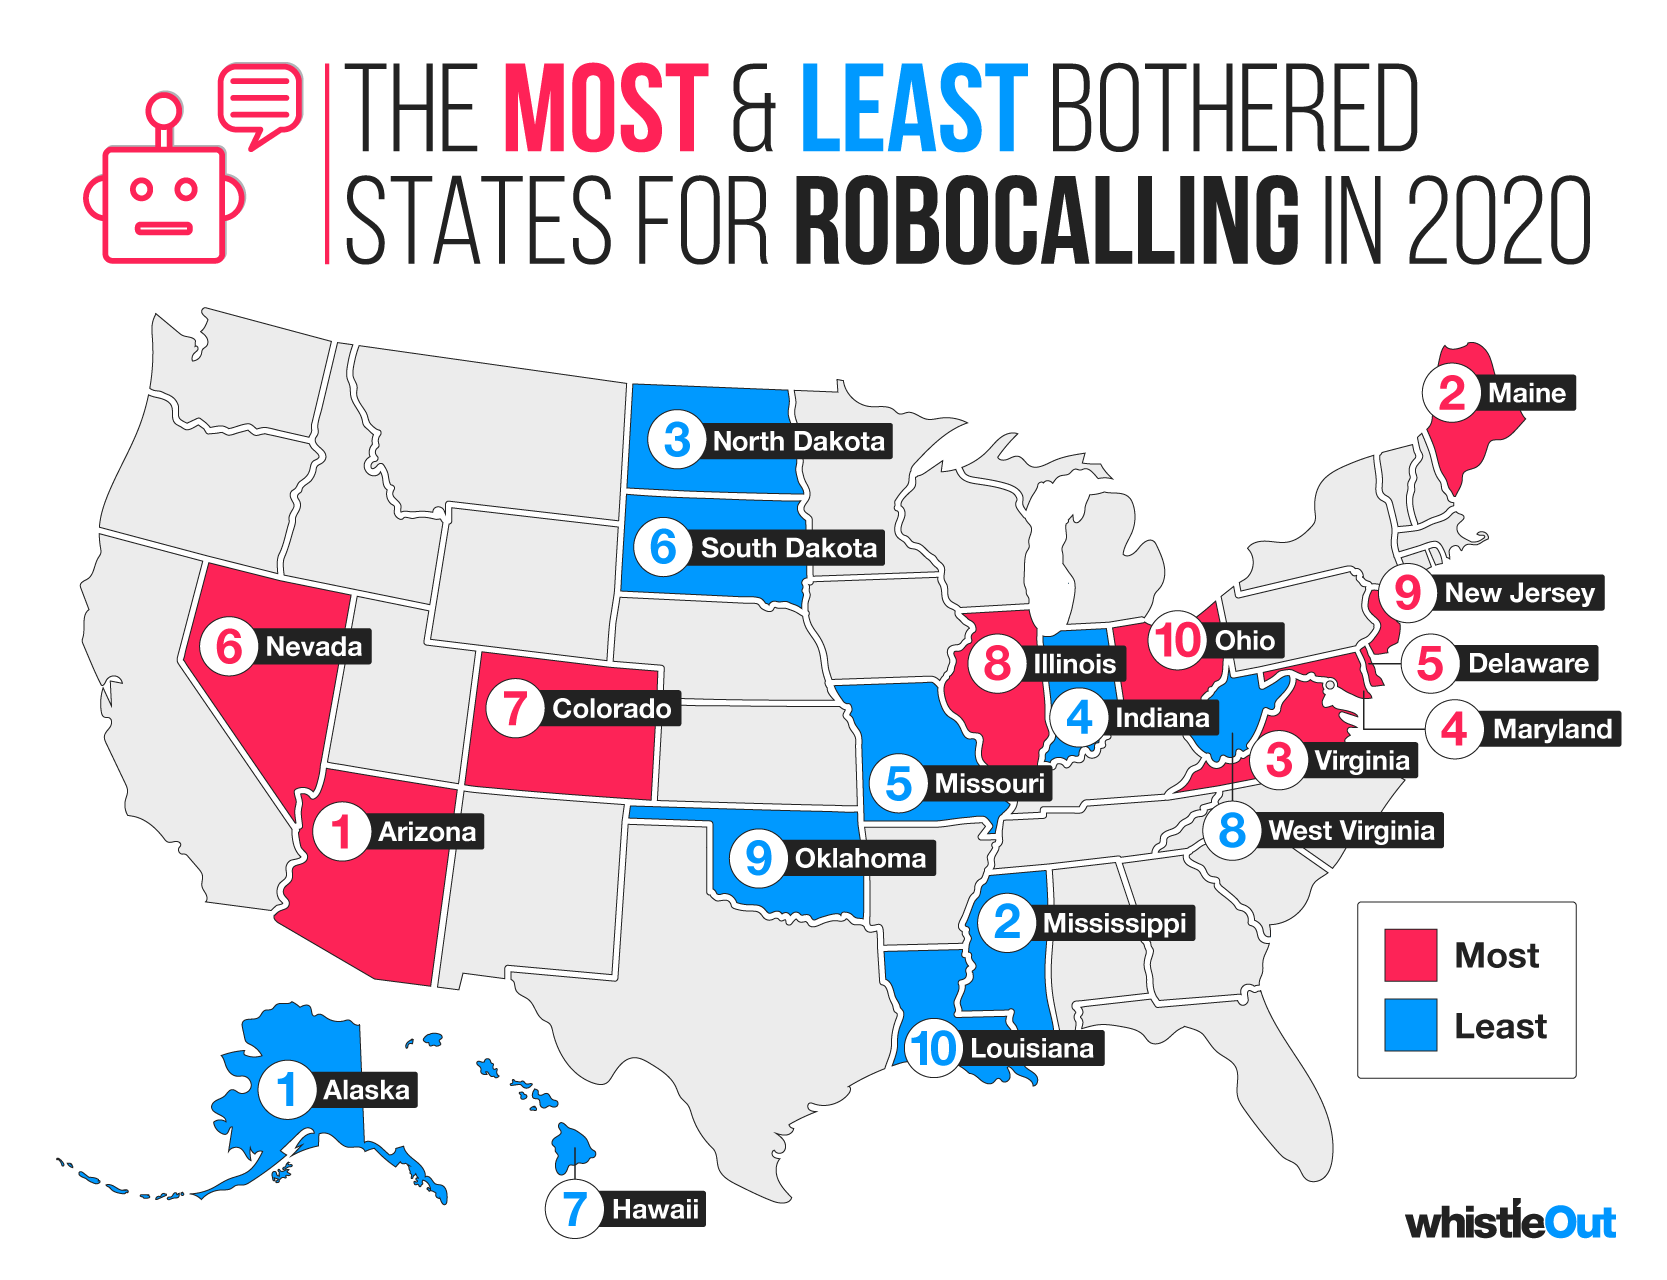
Let’s collectively (and figuratively) pour out an AriZona Green Tea for the Arizonians who are apparently the main targets of Robocallers. Before you theorize that maybe spammers favor the hotter states, consider the second worst state for robocallers—Maine! Why would Robocallers want to bother the chill folks of Maine? After Maine comes Virginia, Maryland, and Delaware. The madness just continues from there. However, amidst the madness we did find a pattern: Of the top ten most bothered states, half of them line the east coast.
On the other end of the spectrum is Alaska. Hey, Alaska. . . whatever your secret is to reducing Robocalls, please let every state in the top 10 most bothered states know.
Methodology
To figure out which states were the most bothered with Robocalls, we wanted to measure robocalls per capita, but also factor in how annoyed people felt about the constant calls. We used two sources to extrapolate the most annoyed states about Robocalls:
-
The amount of “Do Not Call” complaints registered by the Federal Trade Commission per state.
-
The amount of Robocalls made per capita around the country.
Each measurement was normalized on a 0-1 scale with 1 corresponding to the measurement that would most increase the final score and 0 corresponding to the measurement that would decrease the final score. These adjusted measurements were then added together to get a score out of 100. The higher the score, the more annoyed the state felt about Robocalls.
Angelo Ilumba
Senior Writer

Find a better phone plan
Thousands of cell phone plans unpacked. All the facts. No surprises.


.png?w=280&h=280&usm=20&usmrad=0.8&fit=crop "Best Cell Phone Deals for July 2026: Get the New iPhone 17 for Free")


")


.jpg?w=280&h=280&usm=20&usmrad=0.8&fit=crop "How to Switch to TracFone and BYOP")
